Profiler
4/21/2026
I spent the morning figuring out how to attach webps to blog links on my main page. I uploaded the third article so far, and in my test reloadable C server, I was staring blankly at my home page. I love the contrast of the silly software rendered background against the webps of the black background game engine with a little skeleton running around. this is wild. I just sat and stared at my website for like 5 minutes lol.
So yesterday, I was pairing with some friends, and I found that when I fullscreened, our performance tanked. Lots of pink bars as a friend said. So last night, I figured the plan for tomorrow, (which is now today), was to make a profiler. I sketched out a debug event struct. I haven't looked at my old profiler code, I haven't referenced handmade hero. I just sketched out a rough profiler idea.
So before I can think about RAII, and use Cpp to do that little scoping trick from handmade hero, I need 2 functions for starting and stopping a timed block.
                void ProfileStart(void* profilerMemory, uint64_t* maxMemorySize, uint64_t* memoryUsed, const char* funcName, int line){
                    uint64_t start = __rdtsc();
                    debug_data* debugData = (debug_data*)profilerMemory;
                    debugData->readIndex...


                }
                void ProfileStop(void* profilerMemory, uint64_t* maxMemorySize, uint64_t* memoryUsed, const char* funcName, int line){
                    uint64_t stop = __rdtsc();
                    debug_data* debugData = (debug_data*)profilerMemory;
                    debug_event* curEvent = debugData->events + debugData->readIndex++;
                    curEvent->type = debug_timing_stop;
                    curEvent->time = stop;
                    curEvent->function = funcName;
                    ...
                }
Already a huge mess, I skipped lots of different Assertions to check that the index is correct for example. Lots of assertions. I don't know how to write static tests for this sort of thing, so I will instead add Assertions that crash me instantly if the assertion evaluates to false.
                #define MAX_DEBUG_EVENTS 4096
                Assert(debugData->readIndex < MAX_DEBUG_EVENTS);
Oh yea I should show you what debug_data looks like
                #define MAX_DEBUG_EVENTS 4096
                #define MAX_DEBUG_FRAMES 128

                enum debug_event_type{
                    debug_none,
                    debug_timing_start,
                    debug_timing_stop,
                    debug_frame,
                };

                struct debug_event{
                    debug_event_type type;
                    uint64_t time;
                    uint64_t cycles;
                    const char* function;
                    int line;
                    int id;
                    int depth;
                    uint64_t frameNum;
                };

                struct debug_frame{
                    uint64_t frameNum;
                    uint64_t cycles;
                };

                struct debug_data{
                    debug_event events [MAX_DEBUG_EVENTS];
                    int readIndex;
                    int writeIndex;
                    bool recording;
                    int curEventID;
                    int depth;
                    uint64_t frameNum;
                    int latestFrameEntryIndex;
                };
Dont worry it only gets worse from here! We store types of events. Start/stop/frame. The frame type is used to cap off all the events from the latest frame. It is called in the base main() function. In fact, this is simply the brittle system setup, I haven't actually tested stacking yet. For example, how would you time the function inside main()?
                /*PLATFORM LAYER*/
                main(){
                    ProfileStart()

                    /*GAME DLL LAYER*/
                    Update()

                    ProfileStop()
                    ProfileFrame()
                }
You would need to put a similar ProfileStart/Stop block inside Update(). That would give you a stretch of events in the array that looks like this:
            debug_event events[4096]; int readIndex; //circular buffer
                 4096 is wrapped to 0                //readIndex = (++readIndex) % 4096
            indices :       ...4095 0       1       2       3       4       5 << HEAD
            evntType:       none    start   stop    frame   start   stop    frame
We read backwards from where the latest index is. readIndex is a bit of a misnomer, its also our write index. Its a complete misnomer. It works, so next I need to make it make sense, and then good.
Every frame, we update our UI system. This is the second UI system I've written. The first one I wrote was too constrictive. I had specific window types, like inventory, profiling, options... They all had very specific functions to manage their state and rendering info. Then I tried to make Debug windows that were modular enough for me to do anything with them. I wound up having concepts like inline elements, all children of some larger element. It was crazytown. This time around, I figure all I need are button/slider functionality, and use custom callback functions to handle unique click functionality. So I figure I can draw every single frame measurement as a button element. Then attach a function pointer to each button element. So when it is clicked, we can call a function that sets the currently selected index of profiling events to display in the window.
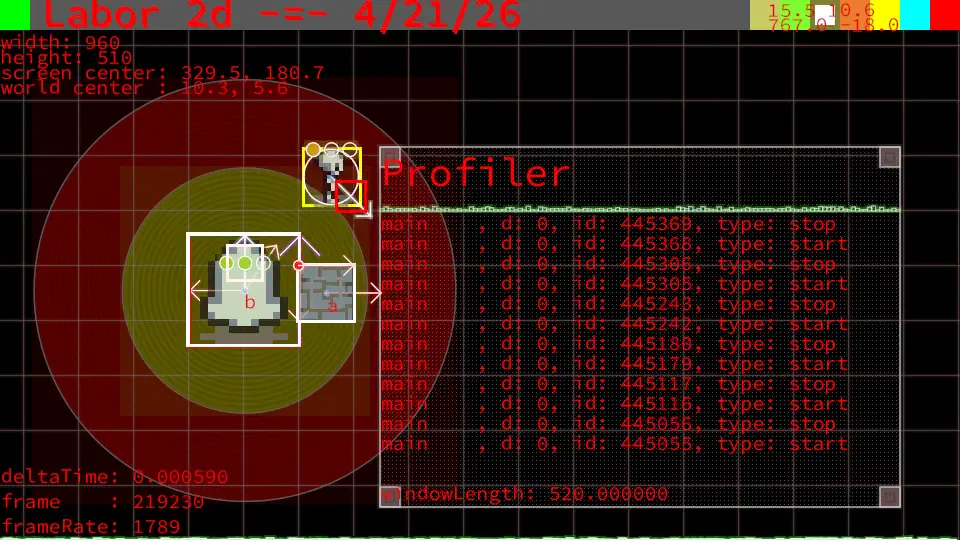
Thats the next step. But in order to do this, I don't save any information. I don't save anything outside of debugData. I use a temporary array of events in the UI update function, and we loop backwards from the circular buffer's readIndex. At the bottom of the screen, we are displaying a little performance graph. We want to perfectly mimic those measurements, via a completely new and different pipeline, in a UI window now. The bottom graph is the __rdtsc() measurement of the main game loop. With the new profiling system, we are now wrapping the main() function in its own set of profiling events. But we also need to check if its a fixed update!
You see in the little webp, in the bottom left corner, we have a framerate. These are how many frames we drew this second. That is a lot! We have uncapped the GPU, we are using immediate mode in webgpu. We are running as fast as our laptop rtx 4050 will take us. So we need to fix our timestep. I have constrained the game update logic to run 60 times per second. 60 fps. 16.66 ms of time per frame. We run the main game loop thousands of times per second, but what we care about is the logic heavy fixed update. That will be the most expensive frame. So we need to discard all non fixed update frames. Otherwise if we run at 1000 frames per second, we will fill up the debug array within 4 seconds. The problem is that I want to constrain the profiler to only show the past 2 seconds of history. So I only draw 128 frames. 4096 events total. 3x events atleast per frame (start/stop/frame). at 1k fps * 3 events, we only have 1.5 seconds of history We would start to draw repeating data in the profiler window. That is another reason to discard all non fixed update frames.
1. We dont care about non fixed update frame measurements (yet)
2. We want to draw atleast 2 seconds (60 fps * 2 = 120 measurements) of history.
Those are the main constraints. We process backwards through all the events every fixed update, in the UI update. Because we process in the middle of the frame, the latest event is a start timing in the outer main() function. So we need logic to skip events from the current frame, and to keep a stack of stop events. And pair them off with start events. This thing is truly grotesque but if you really want to see the code here it is:
link to a sample: profilerUI.cpp
Was any of this remotely useful? I did about as much I can think of. Hard to really put it all into words, so I just linked the code instead lol. This is my first real attempt at a blog post like this. I have no idea what to do lol. I just wanted to document the current work. I am very happy with how it turned out. I of course still need to setup the function pointers. Still much more to do. I would ideally be working on the game.
The goal is to make challenging yet rewarding and deep combat. I have a lot of constraints. I don't have much art. I can just draw squares and colors instead for now. I have my own physics engine (based off box2d lite) Oh yea I should mention that I have a physics rollback system. Thats unrelated. I can ramble on and on...
I mean what I want to do is experiment until it feels fun to play. I think that is the main challenge of video games. Make something that feels fun and rewarding to play. Reward for me is when I learn about extra depth in how to play the game. If it can be an acquired skill, or dependent on good hand eye coordination, then it is interesting enough for me. So that is the benchmark I am shooting for. How will I get there? I have no idea.
I have the next 4 months to figure out some kind of interesting game loop. I can tweak combat, AI behavior, physics, anything. The idea is that I experiment in every possible way until it feels fun to play.
Thats all I feel like writing. If you have any questions, even 'why did you feel it was necessary to write this', please reach out! Thanks for reading!